Interactive Dashboard of U.S. Wildfire Incidents
Project Overview
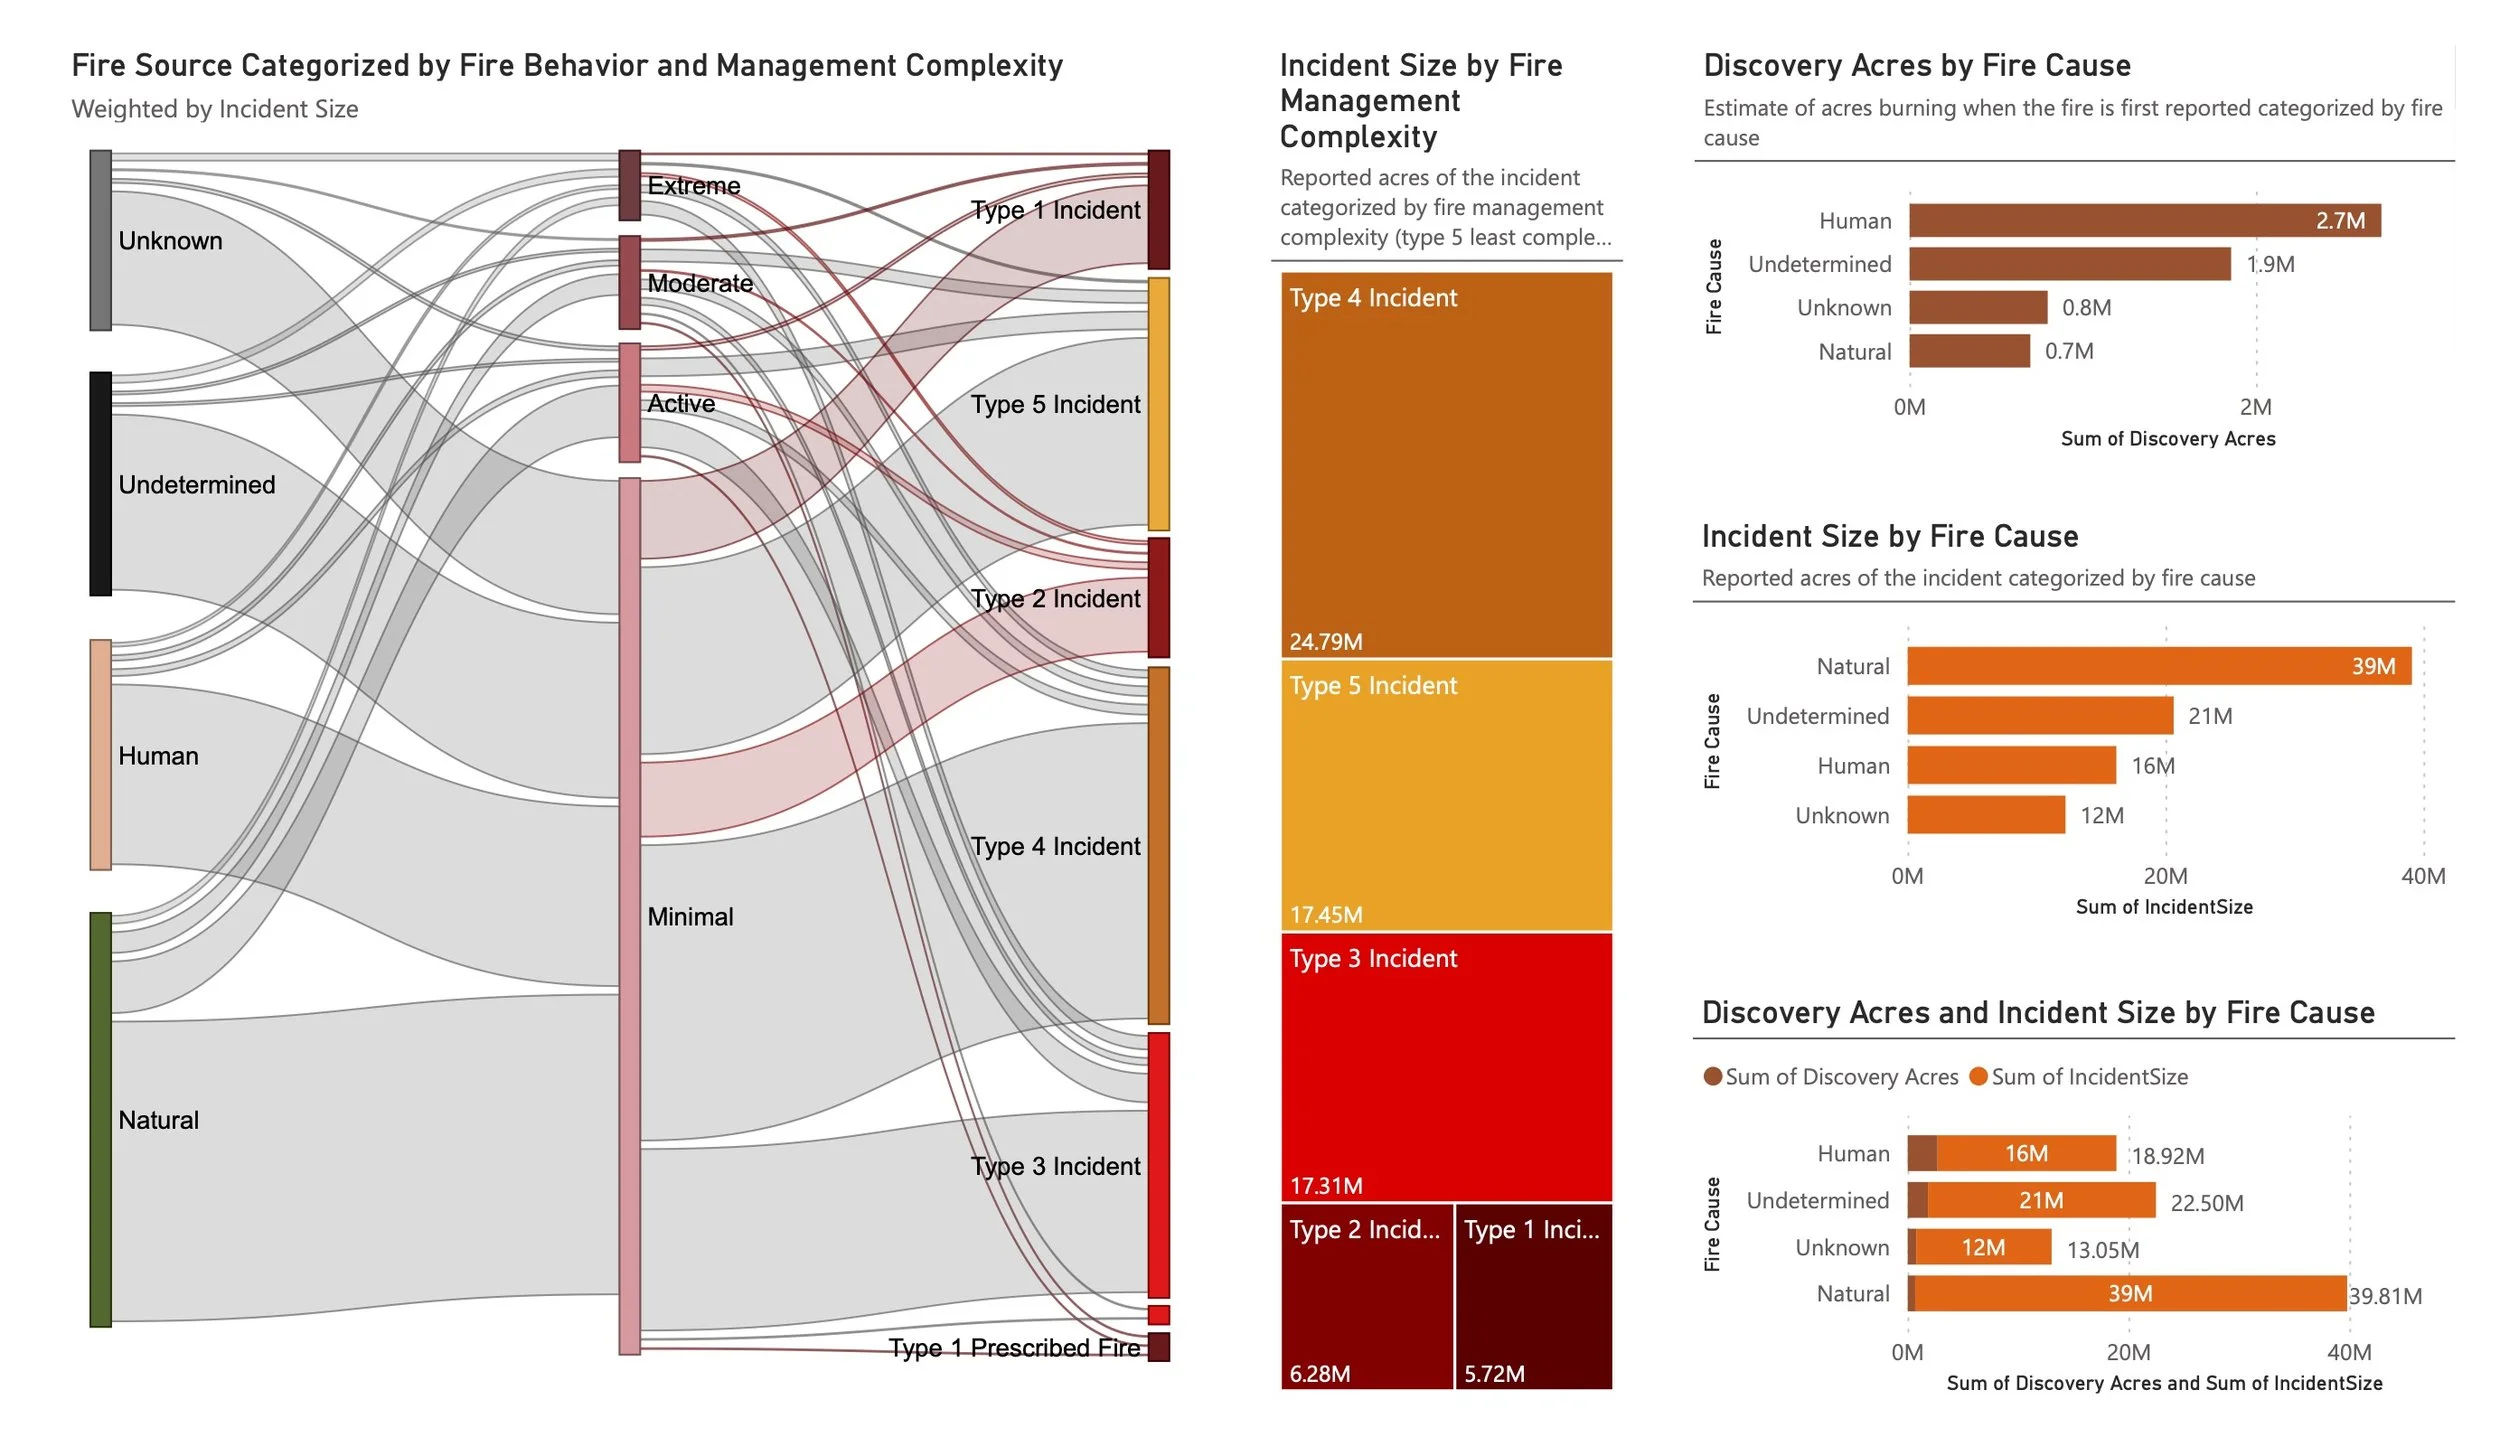
This project focused on visualizing wildfire incidents across the United States reported to the Integrated Reporting of Wildland-Fire Information (IRWIN) system. Using data from the National Interagency Fire Center, the dashboard was designed in Power BI to communicate key dimensions of wildfire activity, including incident size, complexity, location, fire source, and fire behavior.
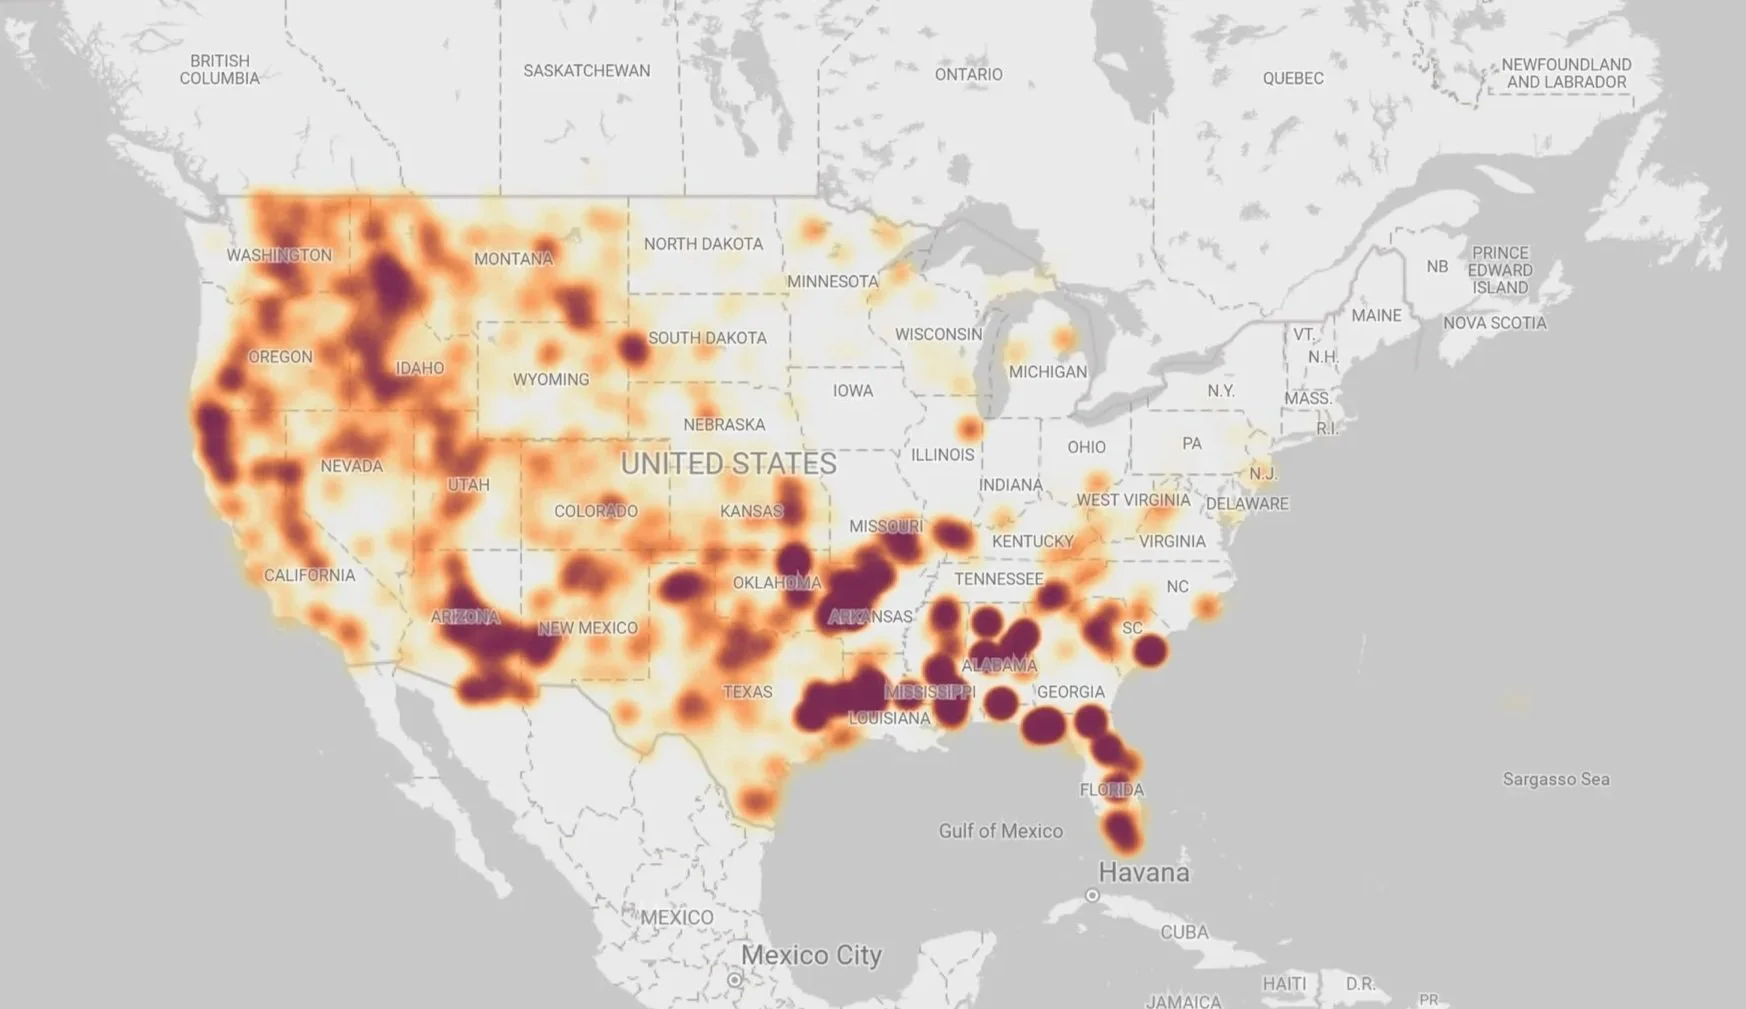
The dashboard brings together multiple visualization tools and graphics to reveal patterns and trends in wildfire dynamics. By translating raw incident data into interactive visuals, the project supports a more accessible understanding of how wildfires evolve across landscapes and jurisdictions. The intent was to make large-scale wildfire data usable not just for fire management professionals, but also for researchers, policymakers, and the broader public seeking clarity on fire risks and impacts.
A defining feature of the dashboard is its integrative approach, bringing together a wide range of wildfire attributes in a single, interactive platform. This allows users to explore relationships between fire sources, sizes, and behaviors while situating incidents geographically for context and comparison.
My Role
I led the development of the Power BI dashboard, overseeing the data preparation, visualization design, and integration of multiple analytical perspectives. Drawing from IRWIN system records and National Interagency Fire Center datasets, I structured and cleaned the data for effective analysis, ensuring consistency across complex reporting categories.
Through this process, I bridged technical data analysis with intuitive design, delivering a tool that transforms national wildfire records into an interactive narrative of fire behavior and management challenges.